Investment Results & Data - 2012 to 2014
As stated in our investment policy documents,
60%-80% of our investments (assets where PatentsFund.com
acts as the trustee) are invested in public companies traded on
NYSE, NASDAQ, Nikkei, TASE and other stock exchanges.
The exact portion invested depends on
the individual investment agreement signed.
We are proud to present our performance data
for this significant portion.
We are proud to declare that our conservative long-term
approach proved itself also starting 2012, as we invested in a similar
way to what we did during 2010-2011, yet achieved wonderful combined
results for 2011-2012 that are far better then the performance of
the markets during 2011-2012. The same apptoach continued in 2013
& 2014.
Emphasis on fiscal year 2012: many transactions were made
during 2012. These involved carefully selected companies with strong
IP, reacting to market trends on real-time. We also enhanced our
investment portfolio with promising real estate firms, promising
firms from the energy sector, and companies with strong IP in the
food & genetics arena. The methodolgy was similar to the one
created during 2010.
In 2012 we have liquidized most of our older funds and migrated
them into alternative investments such as in European real estate,
which had an effect on our results (which improved 2013-2014 - see
the new venture ISRA-BERLIN - http://www.isra-berlin.com,
we can now state we entered the German real estate market with superb
timing), as only new funds are now directed into IP investments
and previous funds including profits from the years 2006-2012 are
now secured so most of them migrated into European real estate,
including our new focus on Berlin, Germany (via ISRA-BERLIN - http://www.isra-berlin.com).
This move was done to make sure our profits and results in the last
years will not be at risk, so these funds were allocated to "low
risk" and more traditional investments.
The selected companies in 2012 were (new funds
only - older funds mostly sold and migrated into alternative investments):
|
Internal Serial Number
|
Company
|
Symbol
|
| 39001 |
Northen Dynesty |
NAK |
| 21006 |
Elbit Systems Ltd. |
ESLT |
| 21005 |
Fujitsu Component Ltd. |
6719:JP |
| 39002 |
Crosstex Energy Inc |
XTXI |
| 20015 |
Hewlett-Packard Company
|
HPQ |
| 21004 |
NEC Corp. |
6701:JP |
| 39003 |
LOWES Corp |
L |
| 39004 |
Crosstex Energy LP |
XTEX |
| 39005 |
Anglo American Plc |
AAUKY |
| 20079 |
Sun Microsystems Inc. |
JAVA |
| 20105 |
Microsoft Corporation |
MSFT |
|
39006
|
Monstanto Co |
MON |
|
21001
|
Nokia Corp. |
NOK |
|
39007
|
SOHU.COM Inc |
SOHU |
|
39008
|
Syngenta AG |
SYT |
|
39009
|
Brookfield Homes |
BHS |
|
20107
|
Google Inc. |
GOOG |
|
21003
|
Broadcom Corp. |
BRCM |
|
21002
|
Sprint Nextel Corp. |
S |
|
20109
|
Amdocs Limited |
DOX |
Average Gross Interest - 2012:
12.22%
Average PatentsFund.com Management
Fee: 1.51%
Average Profit Sharing PatentsFund.com Fee: 2.02%
Average Stock Transaction Costs: 4.13%
Average Interest Generated To
Investors (After Expenses) During 2012:
4.56%
Average Gross Interest - 2013:
17.05%
Average PatentsFund.com Management
Fee: 1.74%
Average Profit Sharing PatentsFund.com Fee: 2.78%
Average Stock Transaction Costs: 0.22%
Average Interest Generated To
Investors (After Expenses) During 2013:
12.31%
Average Gross Interest - 2014:
9.23%
Average PatentsFund.com Management
Fee: 1.51%
Average Profit Sharing PatentsFund.com Fee: 1.20%
Average Stock Transaction Costs: 0.18%
Average Interest Generated To
Investors (After Expenses) During 2014:
6.34%
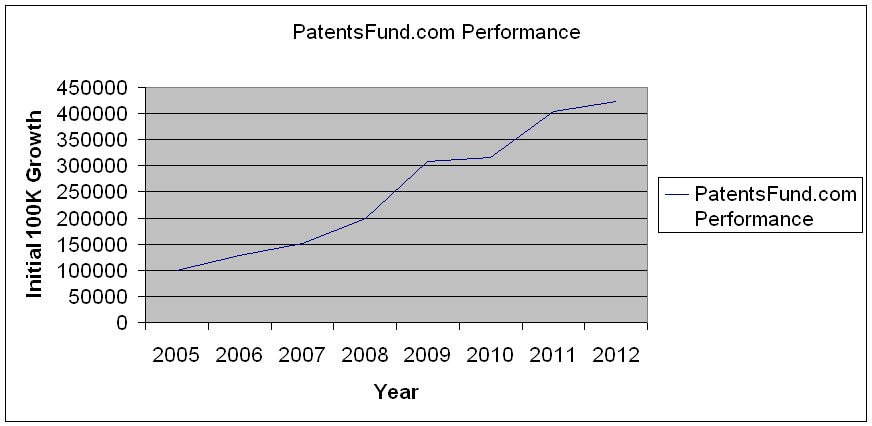
Review of results and performence
from 2005 to 2014:
We are very proud to have generated
(and now secured) superb results for our investors during 2005-2012
- each 100,000$ invested in 2005 became 423,000$ in 2013! (And 449,000$ in 2014 - That's 349% Yield in 10 years!)

Legal Notice
This information is confidential and may contain proprietary
or privileged information.
This information is provided to the recipient, for the purpose of
considering and evaluating the opportunity referred to herein.
It is intended for use by sophisticated investors who are able to
conduct their own investigations and legal and financial due diligence
in connection with it.
The information contained herein is based on assumptions thought
by IWC to be reasonable as of the publication date.
The recipients of this information should independently confirm
and assess all of the information contained herein, including all
projections and in making decisions must rely exclusively on their
own independent inquiries and due diligence investigations.
IWC declares all such investment opportunities to be of very high
risk, and not suitable for the non-sophisticated investor. Information
and opinions presented in this document have been obtained or derived
from sources believed by IWC and/or its subsidiaries and/or its
affiliates to be reliable, but IWC makes no representation as to
their accuracy or completeness.
IWC accepts no liability for any loss arising from the use of the
material presented.
This information does not constitute an offer to sell nor a solicitation
of an offer to buy or subscribe for any securities or other financial
instruments of IWC or any other entity, which shall only be made
through relevant subscription and offering documents, nor to constitute
any advice or recommendation with respect to such securities or
other financial instruments.
© Copyright 2006-2015 - Itzhaki-Weinberger
Consultants (IWC) Limited, All Rights Reserved
Itzhaki-Weinberger Consultants (IWC) Limited
|

